What is OBASHI?
Introduction
OBASHI is a dynamic, contextual model that enables organisations to govern their digital environments.
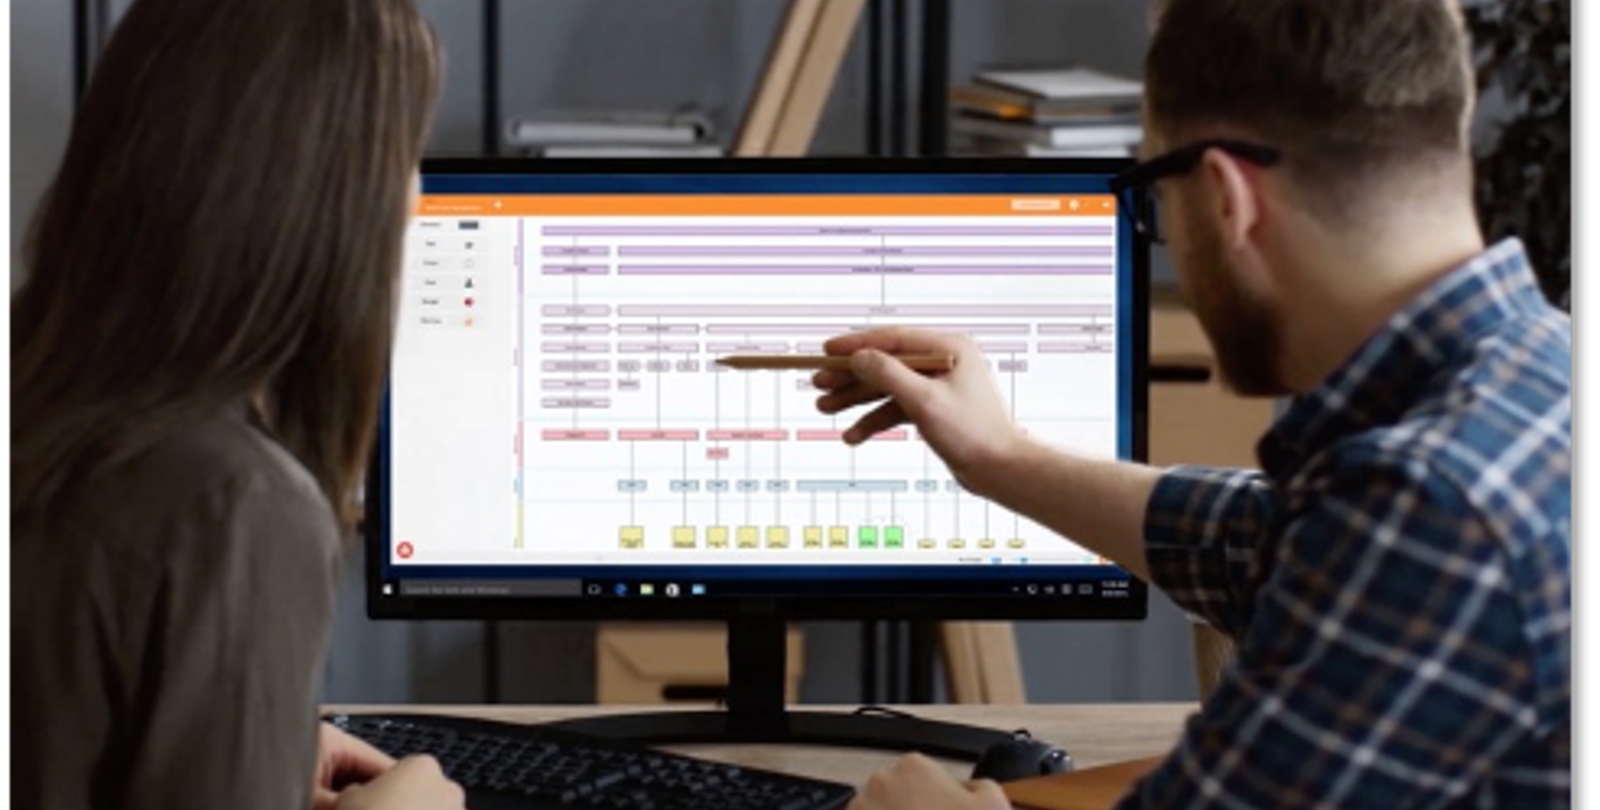
OBASHI enables technical and non-technical professionals the ability to visualise and understand their digital connectivity and dataflows between stakeholders, business processes and technology assets. This provides the capability to simulate risks and impacts that may occur across the enterprise and their supply chain.
The OBASHI Methodology is a six-layered framework for modelling the flow of data between an organisation's people, business processes, and technology assets.
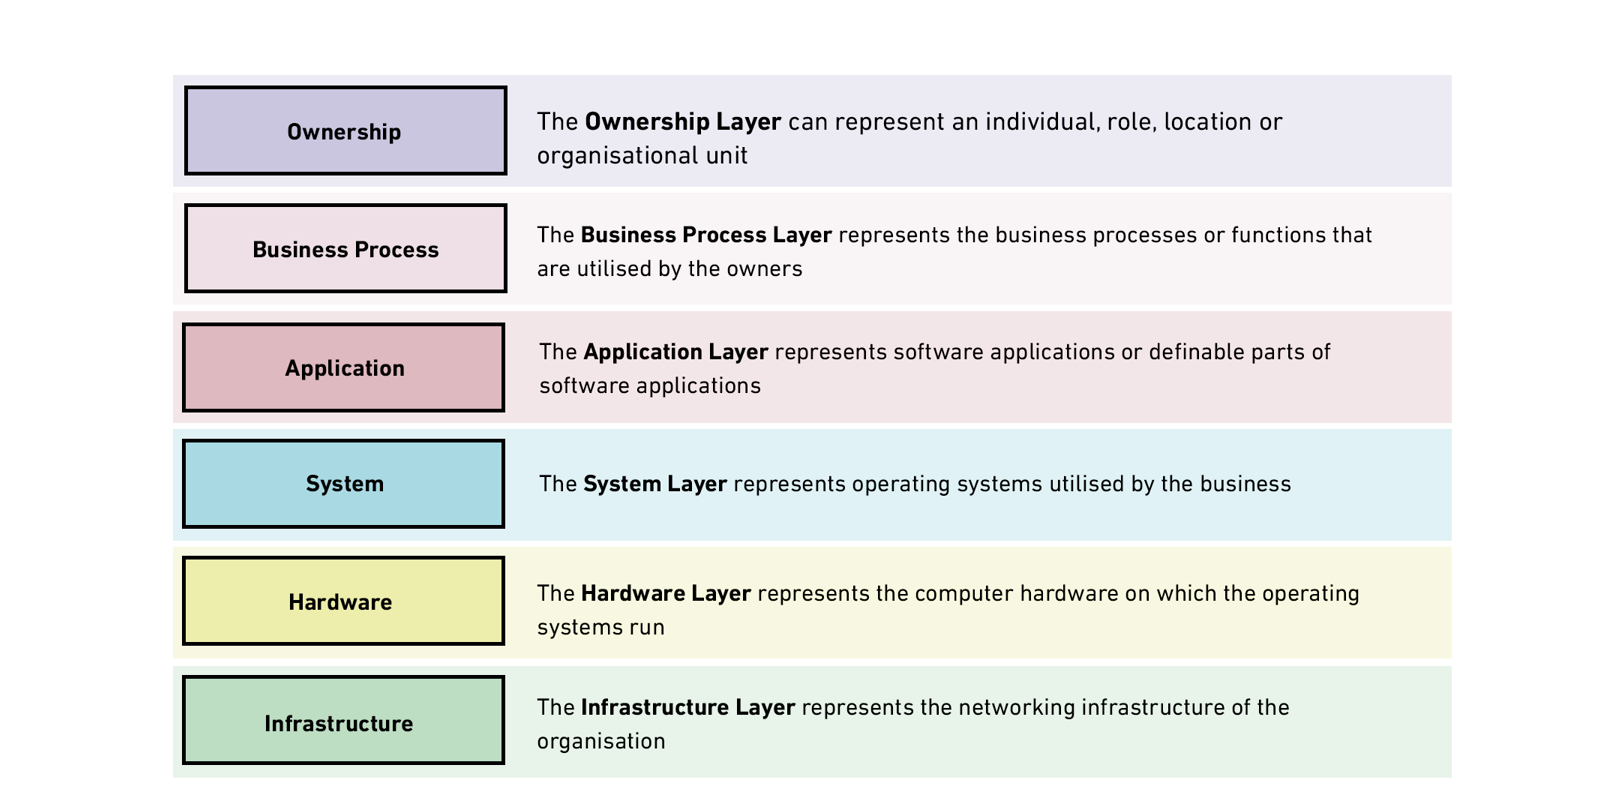
OBASHI stands for the six layers:
- Ownership
- Business Process
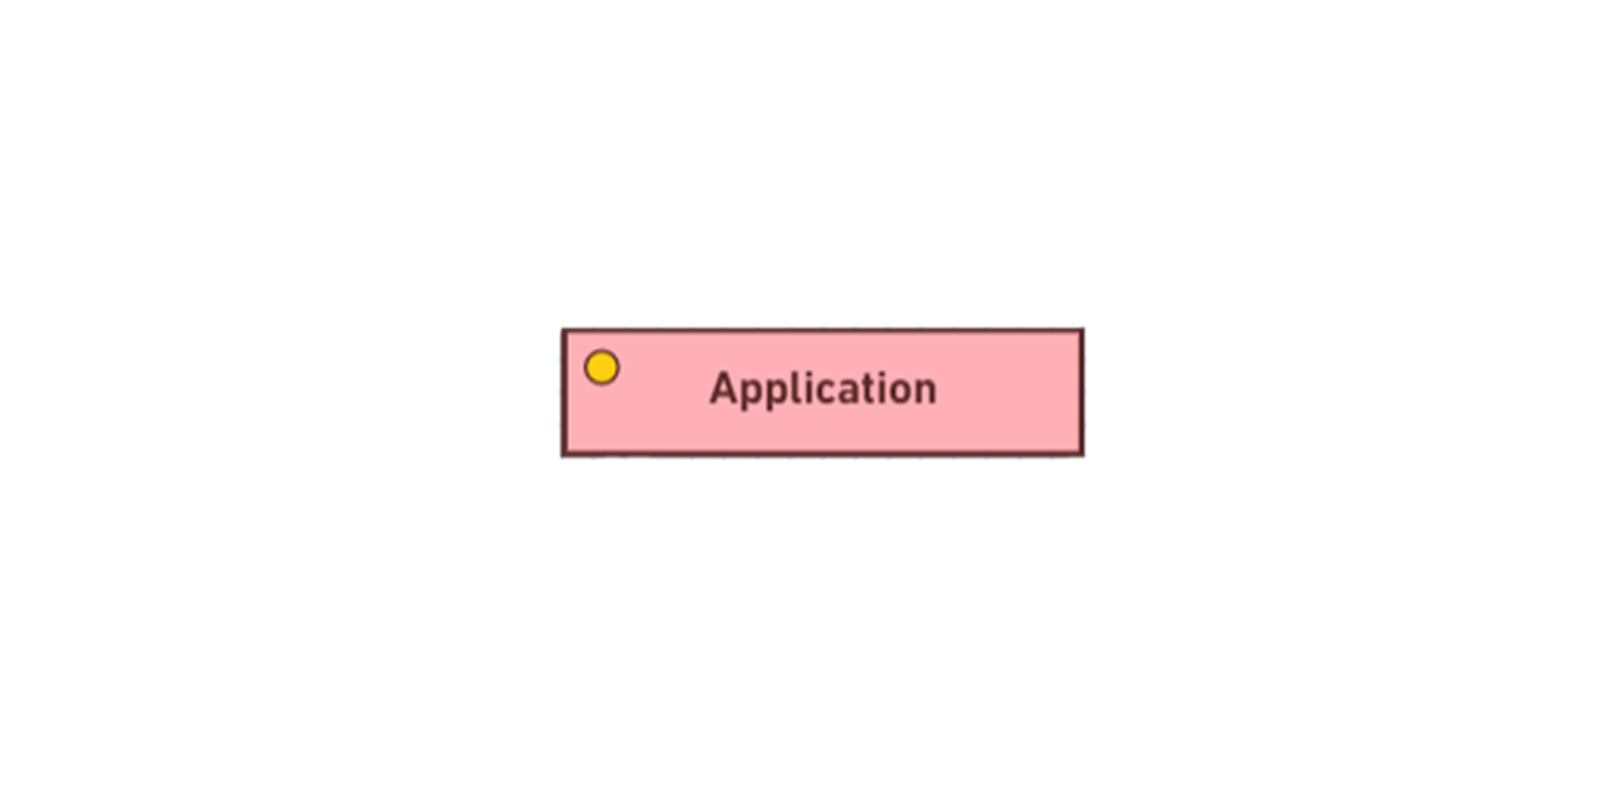
- Application
- System
- Hardware
- Infrastructure
Elements
Every business asset is represented on an OBASHI diagram as an Element. Elements represent owners or stakeholders, business processes, and technology assets. They are the building blocks of every OBASHI model.
Each Element:
· Represents a business resource or asset
· Can have data or documentation embedded behind it
· Can be connected to other Elements to show their relationships and dependencies
Layers
Each OBASHI Element is placed in their respective layer with each Element positioned above other Elements they own or utilise. Elements can also be placed hierarchically within a single layer to highlight reporting structures, smaller tasks and workflows, or sub-applications.
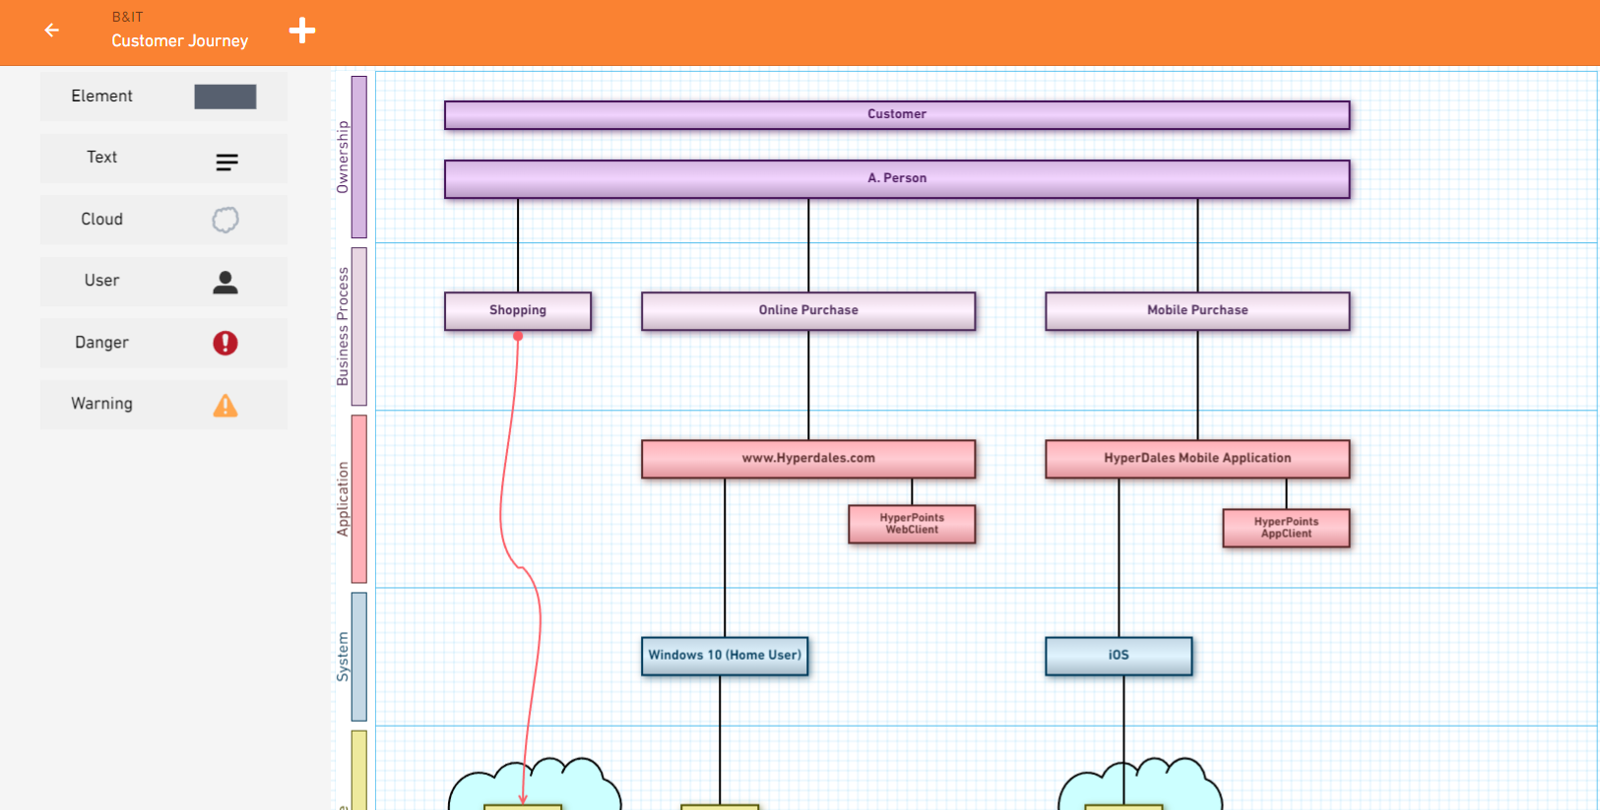
Business & IT Diagrams
Business & IT diagram (B&ITs) show the logical and physical relationships between stakeholders, business processes, and the technology assets that support them.
Once Elements are placed into their respective layers, connections and dependencies are then added to model the logical and physical relationships between them.
In short, Business & IT Diagrams create the ‘big picture’. Stakeholders can see their business processes and support technology assets in context. This is particularly useful for identifying dependencies and performing impact analysis.
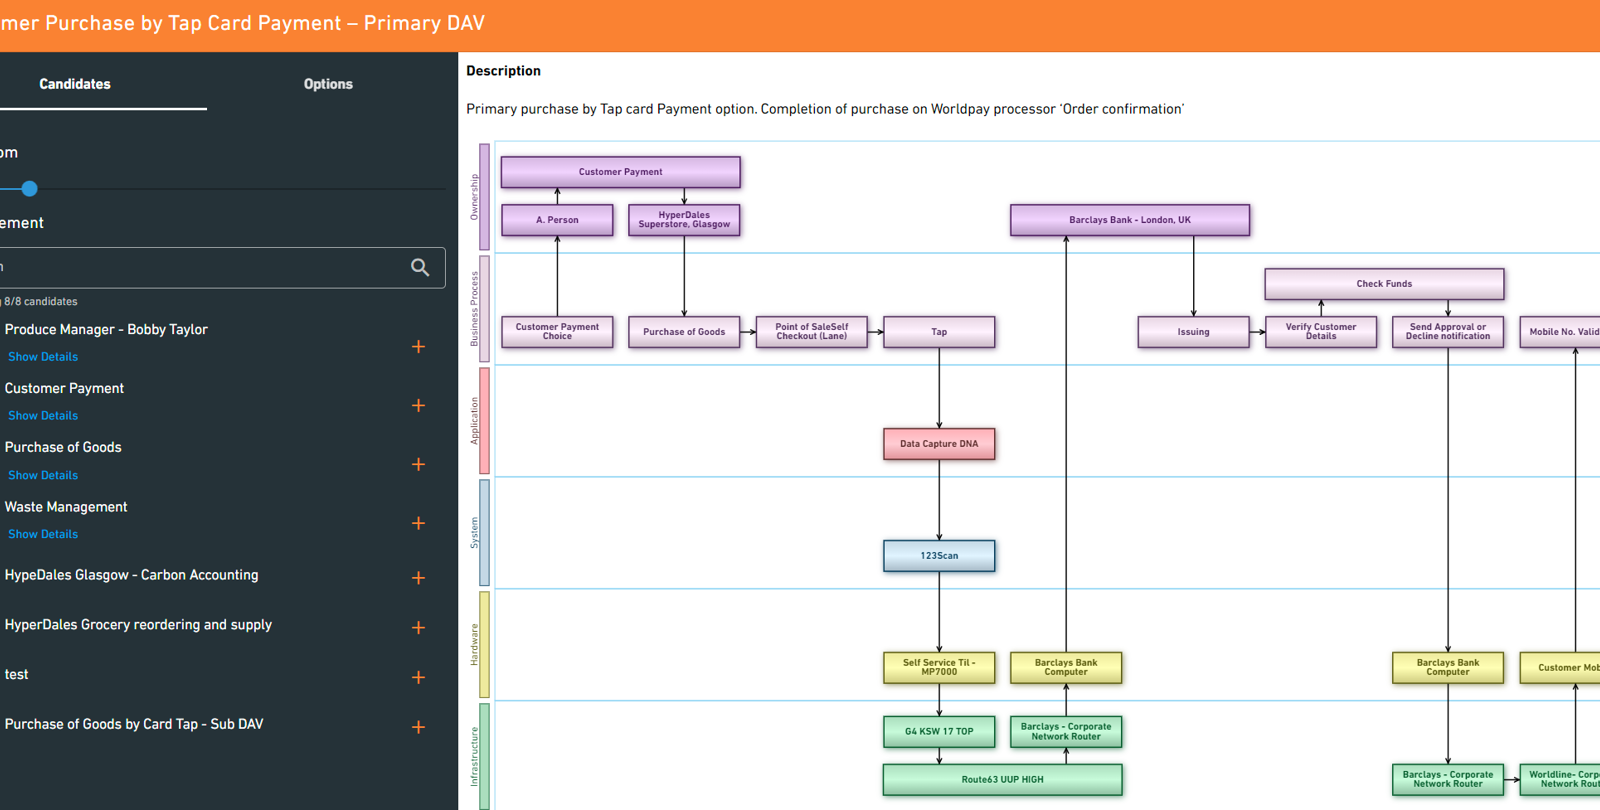
Dataflow Analysis Views
Unlike Data Mapping, which creates definitions of data structures for activities such as data exchange and data analysis, Data Flow Visualisation is the process of mapping the path the data takes on its journey from point A to point B.
Any disruption on the data’s journey can have an impact on the business, so it is important to have a complete picture of what stakeholders, processes and assets support a dataflow.
Business & IT diagrams form the basis of OBASHI’s Dataflow Analysis Views (DAVs) which enable the visualisation of individual flows of data between stakeholders, business processes and technology assets.
DAVs show end-to-end data flows across an organisation, removing ambiguity and providing a platform for further analysis and optimisation.
Getting Started
To get you started, you receive Section A of the OBASHI Methodology in PDF format for free when you create an account.
You can then start a trial of the software which gives you access to the full OBASHI Methodology, project quick-start guides and other learning materials.